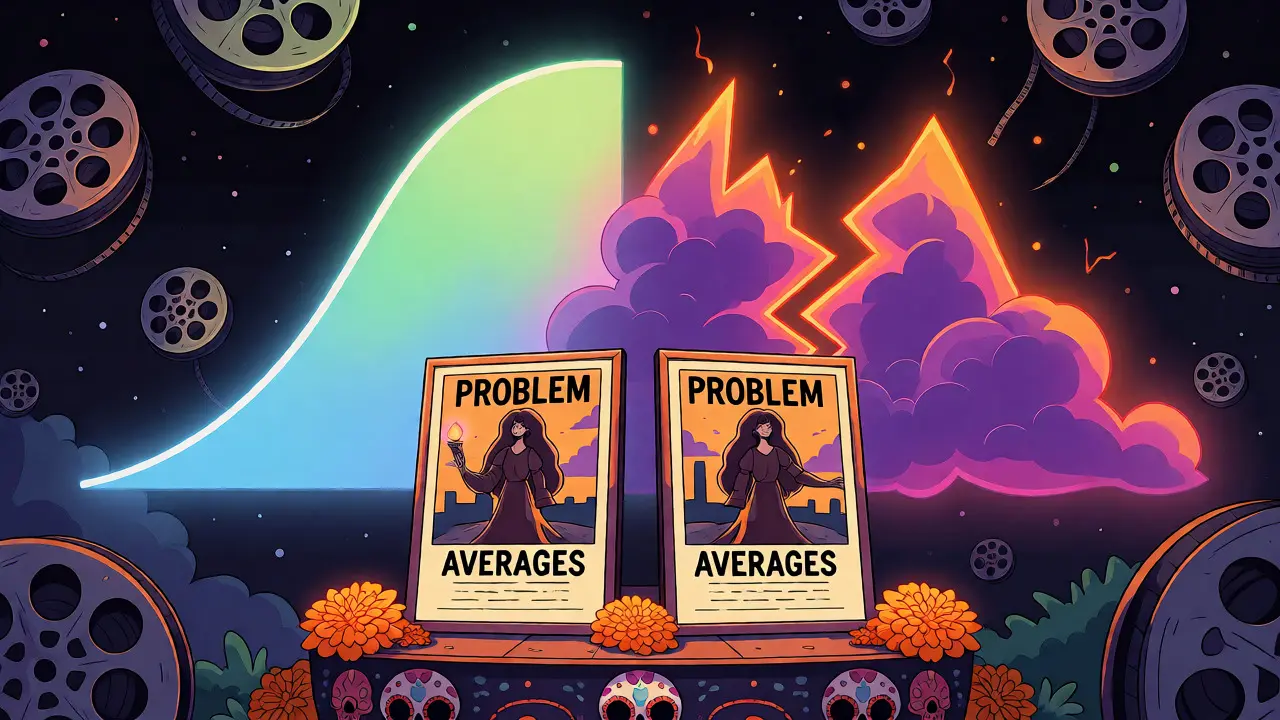
Ever wonder why a movie with a solid 7.5 average feels completely different from another one with the same score? The number alone lies. It hides the chaos of human opinion behind a single decimal point. Movie Rating Visualization is the art of unpacking that number. It reveals whether a film is universally liked, fiercely debated, or loved by a tiny cult while hated by everyone else. We are going to break down how to use heatmaps, distributions, and outlier detection to see what’s really happening under the hood of your favorite films.
The Problem with Averages
Imagine two movies. Both have an IMDb rating of 6.8. One is a generic action flick where most people gave it a 6 or 7 because they were bored but not angry. The other is a divisive horror film where half the audience gave it a 10 and the other half gave it a 3. The average is identical, but the experience is worlds apart. Relying solely on the mean (average) throws away critical context. You need to look at the shape of the data, not just its center.
This is where Data Distribution comes in. If you plot every single vote for those two movies, the first one looks like a gentle hill centered around 6. The second one looks like a valley with peaks at both ends-a bimodal distribution. Seeing this shape tells you instantly that the second movie is controversial. The first is just mediocre. Your viewing strategy should be totally different for each.
Heatmaps: Spotting Patterns Across Genres
If you want to compare hundreds of movies at once, individual histograms get messy fast. Enter the heatmap. A Rating Heatmap uses color intensity to represent frequency. Darker colors mean more votes at that specific rating level. This tool is perfect for spotting trends across genres or eras.
For example, if you create a heatmap of all Horror Movies released between 2010 and 2020, you might notice a distinct pattern. Horror ratings often skew lower than dramas. But here’s the interesting part: some sub-genres, like psychological thrillers, show high variance. Their rows in the heatmap light up at both the low end (bad jump scares) and the high end (brilliant twists). Meanwhile, romantic comedies might show a tight cluster around 6.5, indicating predictable mediocrity.
You can also use heatmaps to track director consistency. Plot a director’s filmography over time. If their early work shows bright spots at 8+ and later work fades to dull greens at 5-6, you have visual proof of a career decline. No need to read reviews; the color shift tells the story.
Distributions: Unimodal vs. Bimodal Films
Let’s dig deeper into the shapes. Most people think ratings follow a normal bell curve. They rarely do. Understanding the three main types will change how you pick movies.
- Unimodal (The Safe Bet): One peak in the middle. Most voters agree the movie is "okay" or "good." Examples include mainstream blockbusters like Avengers: Endgame. You know what you’re getting.
- Bimodal (The Controversial Pick): Two peaks, usually at opposite ends. Love it or hate it. Think Sucker Punch or Cats (2019). These are risky watches. If you lean toward one side of the spectrum, you’ll likely love it. If you’re neutral, prepare for disappointment.
- Skewed (The Cult Classic): A long tail extending to the right. Most people gave it a 5, but a passionate minority gave it 10s. This often happens with niche sci-fi or arthouse films. The average drags it down, but the fanbase is intense.
How do you spot these? Look at the standard deviation. High deviation means disagreement. Low deviation means consensus. When browsing a streaming service, don’t just sort by rating. Sort by "number of reviews" AND "rating." A movie with 50,000 reviews and a 7.0 is statistically safer than a movie with 500 reviews and a 9.0.

Hunting for Outlier Films
An outlier isn’t just a bad movie. It’s a statistical anomaly. In Outlier Detection, we look for films that defy genre expectations or temporal trends.
Consider The Room. Its rating is incredibly low, but it has a massive volume of reviews. It’s an outlier because it’s celebrated for being bad. Compare that to a random straight-to-DVD sequel with a 4.0 and only 200 reviews. That’s just noise. True outliers have signal.
To find them, calculate the z-score for each film within its genre. A z-score tells you how many standard deviations a rating is from the genre average. If a comedy has a z-score of -2.5, it’s significantly worse than typical comedies. Why? Maybe it flopped hard. Or maybe it was ahead of its time. Digging into these outliers often leads to hidden gems or fascinating train wrecks.
| Method | Best For | Key Insight | Complexity |
|---|---|---|---|
| Average Score | Quick filtering | General quality estimate | Low |
| Histogram | Single film analysis | Polarization level | Medium |
| Heatmap | Genre/Era comparison | Trends and patterns | High |
| Z-Score | Outlier hunting | Statistical anomalies | High |
Practical Tools for Data Nerds
You don’t need a PhD to start doing this. Several tools make Ratings Analysis accessible.
- Letterboxd: Great for social signals. Their "Top Rated" lists are curated by users, reducing bot noise. Use their filters to see year-by-year breakdowns.
- IMDb Advanced Search: Allows you to filter by rating range and number of votes. Set a minimum of 10,000 votes to avoid skewed small-sample results.
- Rotten Tomatoes: Watch out for the split between Critic Score and Audience Score. A large gap here is a major red flag (or green light) depending on your taste. Visualizing this gap over time can reveal shifting cultural attitudes.
- Python/Pandas: If you’re tech-savvy, download the IMDb datasets. Use libraries like Seaborn to generate custom heatmaps. You can overlay release dates on rating distributions to see how tastes evolve.
Common Pitfalls to Avoid
Data lies if you misread it. Here are traps to watch for.
Recency Bias: New releases often have inflated or deflated scores before enough data accumulates. Wait until a movie has at least 5,000 global reviews before trusting the distribution shape.
Fan Bombing: Popular franchises attract polarized fans. Star Wars sequels showed massive bimodal distributions due to fan wars, not necessarily objective quality. Always check if the controversy is about the film itself or the fandom.
Genre Baselines: Never compare a documentary’s 8.5 directly to an action movie’s 8.5. Documentaries naturally rate higher. Normalize your data by comparing films only within their own genre groups.
Why This Matters for Your Watchlist
Using these techniques saves time. How many hours have you wasted on a movie that looked good on paper but felt terrible to watch? By checking the distribution, you can predict that feeling. If you hate controversial movies, skip anything with a bimodal shape. If you love discovering weird stuff, hunt for high-variance outliers.
It also helps you understand yourself. Do you consistently rate certain directors highly despite low averages? Your personal distribution might differ from the crowd. Tracking your own ratings against the global average reveals your unique cinematic DNA.
What is a bimodal distribution in movie ratings?
A bimodal distribution occurs when ratings cluster around two distinct peaks, typically at the high and low ends of the scale. This indicates that viewers are deeply divided-most people either loved the movie or hated it, with few holding neutral opinions. Common examples include divisive sequels or experimental films.
How do I identify an outlier film?
An outlier film deviates significantly from the norm of its genre or era. Statistically, you can identify these by calculating the z-score, which measures how many standard deviations a film's rating is from the genre average. Visually, outliers appear as isolated points far from the main cluster in a scatter plot.
Why is the average rating misleading?
The average hides the spread of opinions. A movie with consistent 7s and a movie with mixed 1s and 10s can have the same average. Without looking at the distribution (histogram), you miss the polarization or consensus level, which is crucial for predicting your personal enjoyment.
Can heatmaps help choose movies?
Yes, heatmaps allow you to compare multiple films or genres simultaneously. By mapping color intensity to rating frequency, you can quickly spot trends, such as which decades produced the best horror films or which directors maintain consistent quality across their careers.
What tools are best for analyzing rating data?
For casual users, Letterboxd and IMDb provide built-in filters and lists. For advanced analysis, Python libraries like Pandas and Seaborn allow you to download raw data and create custom visualizations, including detailed histograms and correlation matrices.